20th Annual Industry Audit: Year of the Pandemic
Our latest numbers crunch on biopharma financial performance—this one assessing growth and value-generation during the heart of COVID-19—reveals a mix of the familiar and new entrants into the top spots in seven business-critical metrics.


Welcome to Pharm Exec’s 20th Annual Pharmaceutical Industry Audit, covering the Year of the Pandemic. We present a unique financial performance analysis of the top 18 publicly traded biopharmaceutical companies based on 2020 sales revenue. As in our previous Audit, this total of 18 organizations reflects the acquisitions of Celgene by Bristol Myers Squibb (BMS) and Allergan by AbbVie. The Audit is focused on a number of financial performance metrics, particularly critical metrics such as growth in shareholder enterprise value, enterprise value to sales (EV/S), and return on invested capital (ROIC). Regarding the last metric, we introduced the impact of weighted average cost of capital (WACC) in September 2019. WACC adjusts ROIC by assessing the difference between ROIC and WACC.
Methodology


This year’s Audit relies on secondary reported information for the 2019–2020 time period. The metrics are also weighted reflecting their relative importance in assessing a company’s performance. Some metrics are more important than others. For example, sales growth is important, but sales growth can occur as a result of mergers and acquisitions and in-licensing. So it takes a back seat to more critical metrics such as ROIC, which measures how well a company is managed, including margin management (the profit and loss or income statement) and asset management (the use of assets on the balance sheet), and most importantly, whether ROIC exceeds the cost of capital (the cost of debt and the opportunity cost of stock equity, which are reflected by WACC).
Two metrics are included that are not weighted: sales, general, & administrative (SG&A) expenses, or overhead; and profit per employee.
The higher a company performs on a metric is reflected in a ranking based on the number of points it receives per metric. The highest metric for this year’s Audit is 18 based on the number of firms in our Audit. For example, if a company places 17th (second highest) on the critical metric EV/S, it receives 51 points on the metric (17 rank x weight of 3). In another example, if a company comes in at a ranking of five (five places from the bottom), on the metric gross margin (pricing power), its total points would be 10 (5 rank x weight of 2).
Indices
Basic indices are the growth of the US economy and inflation. An organization has to be able to grow faster than the US economy: around 3% in 2019 and higher than inflation as measured by the Consumer Price Index (CPI), about 2% for 2019. Other important benchmark metrics for 2020 include:
- Nasdaq Composite: up 44%
- Dow Jones Industrial Average: up 7.25%
- Standard & Poor’s (S&P) 500: up 16%
- S&P 500 Health Care: up 11.43%
- And, according to Evaluate Vantage:
- Dow Jones Medical Equipment Index: up 22%
- S&P Composite 1500 Health Care Equipment & Supplies Industry Index: up 17%
Sales growth

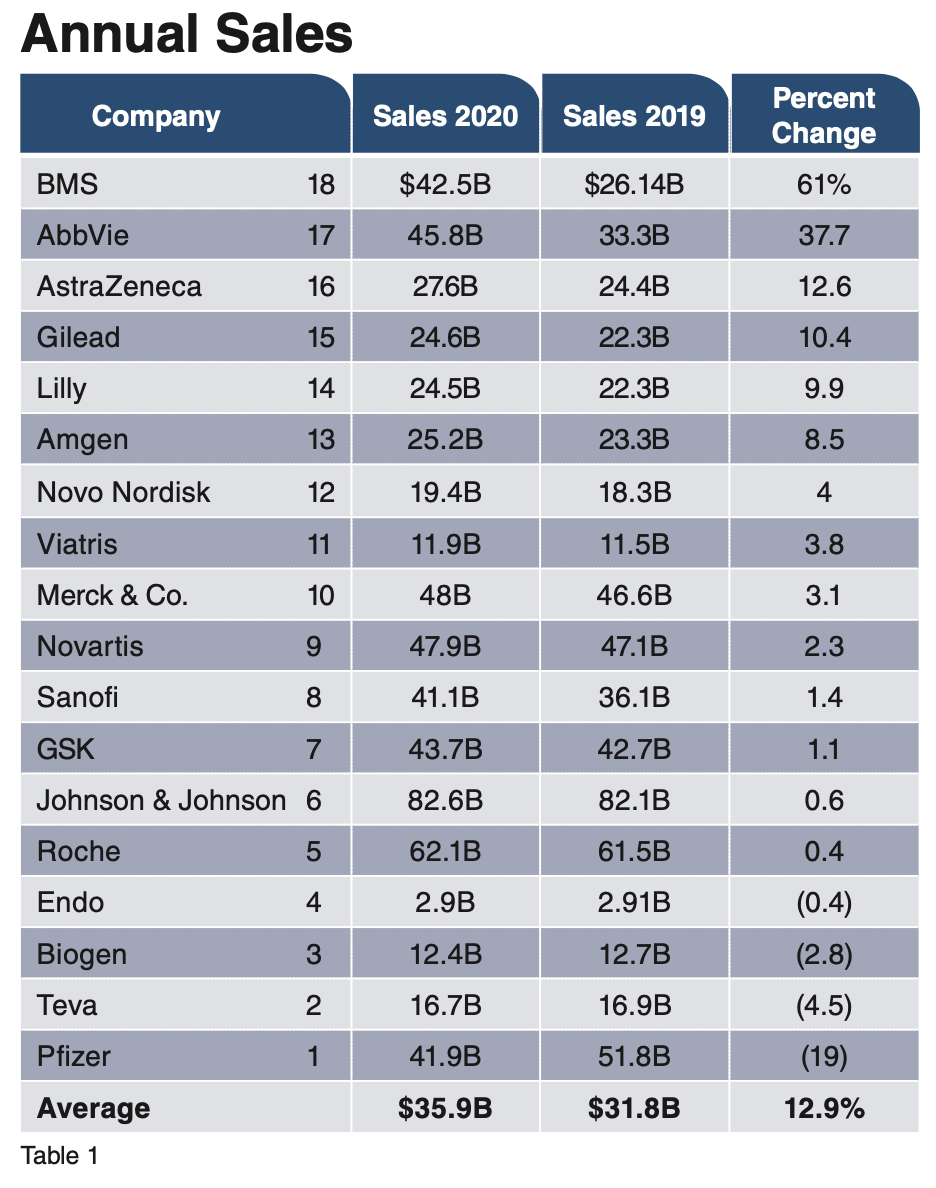

Table 1 shows sales in US dollars along with sales growth for 2019–2020. It is good to grow, especially organically, compared to just acquiring companies. But that’s easier said than done for companies at high sales levels such as Johnson & Johnson (J&J), Novartis, and Roche.
The average dollar sales for our 18 companies was $35.9 billion in 2020, vs. $31.3 billion the previous year: a growth rate increase of 12.9%, outpacing the US economy growth rate (3.4%) and inflation (1.4%). Our 18 pharmas also outperformed the Fortune 500 for 2020 (Fortune 500 sales growth: 3.72%). The key metric in Table 1 is sales growth, with BMS increasing the fastest, due in part to the Celgene acquisition, which was completed in November 2019. AbbVie’s sales growth comes in second, again, with lingering impact of its acquisition of Allergan in 2019. Of our 18 companies, four showed a sales decrease for the pandemic year.
Enterprise or shareholder value and growth
This is the first of the three crunch metrics; EV/S and ROIC are the others. There are other worthy performance metrics (e.g., corporate responsibility, sustainability, the best places for women and minorities to work, etc.), but our focus is financial performance and enterprise value and growth. Did a company create or add to shareholder (enterprise) value or destroy shareholder value?
EV is the sum of an organization’s market capitalization; then add in debt and adjust for cash and other current assets. Simply put, EV is the market value or market capitalization of a company. At present, two firms are fighting it out for the highest company value on earth: Microsoft and Amazon, both at company market caps of more than $1 trillion.

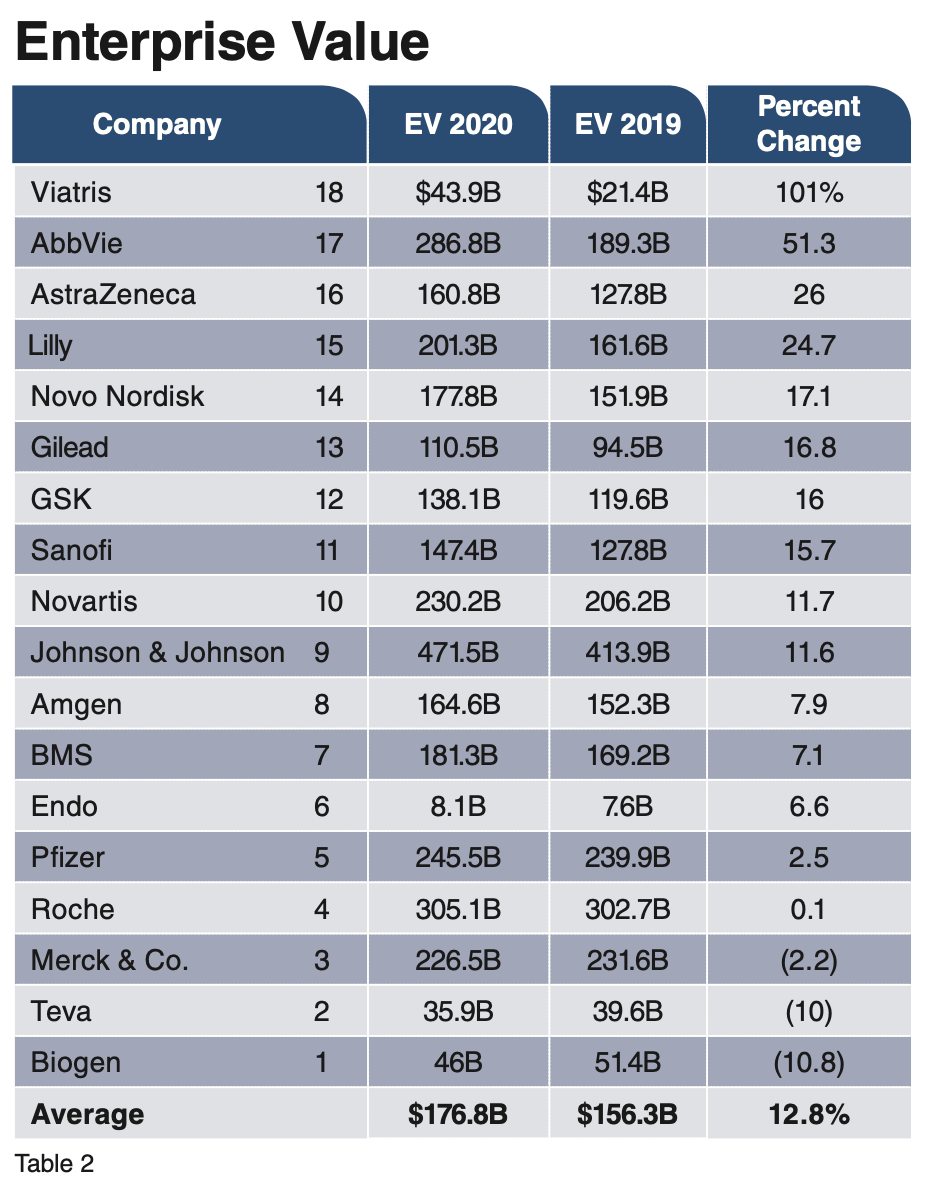

Table 2 shows the pharma with the highest EV is J&J at $471.5 billion, with an average growth for the year of 11.6%. The company that grew its EV the most was Viatris (the Mylan plus Pfizer’s Upjohn spin-off), with a spike of 101%. To put that in perspective, the average EV for our 18 pharmas in 2020 was $176.8 billion, up 12.8%; average EV jumped 18.9% the previous year. Only three companies dropped in this metric.
Enterprise, or shareholder, value for this year’s pharma crop averages $176.8 billion, a 12.8% increase over 2019’s $156.3 billion. This is lower than 2019’s EV growth of 19%.
Enterprise value to sales
EV and EV growth are very important performance metrics. EV/S supplements that metric by assessing which firms are still climbing vis-à-vis so-called “value” stocks—stocks for widow and orphans that, if not growing in upside market cap, still pay noteworthy dividends and are solid businesses.


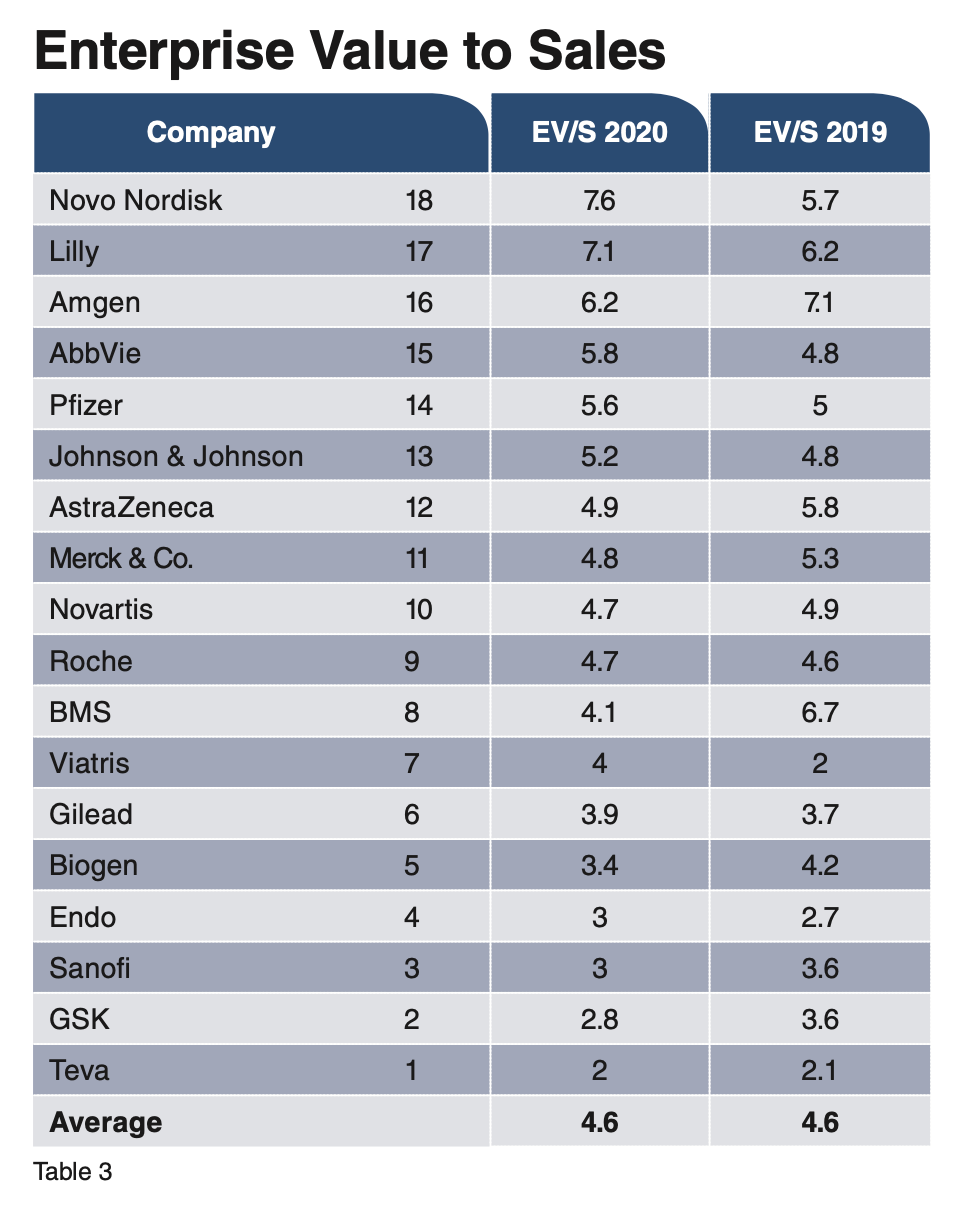
Table 3 lists EV/S. The average EV/S for 2020 is 4.6, the same as 2019. At the top is Novo Nordisk at 7.6, an increase from the drugmaker’s 5.7 EV/S in 2019. Coming in a close second is Eli Lilly at 7.1. Only seven pharmas posted increases in EV/S, compared to 12 in 2019. The higher the EV/S ratio, the more likelihood the company’s performance is going to get better.
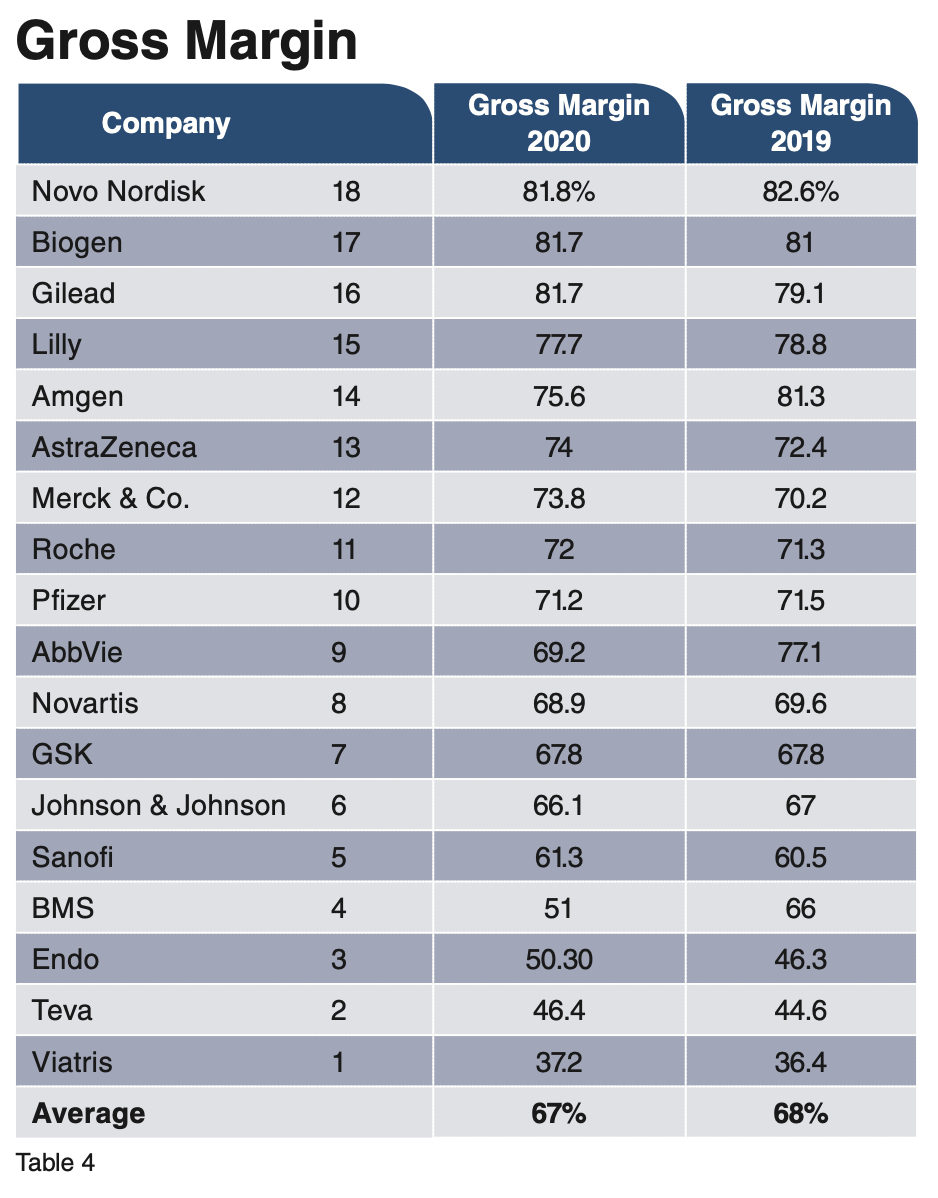
Gross margin
Yes, there is net-net and list price vs. net price, but at the end of the day, there is gross margin, which is tantamount to markup. As Warren Buffet would call it, “the moat around your castle.” Gross margin reflects an organization’s power to maintain or, even better, increase price.
This metric represents total revenue minus cost of goods sold from the income statement. This is quintessential margin management: how price is managed while simultaneously managing operating costs to produce net income. The higher the gross margin is, the more a company is able to cover operating expenses, including SG&A. Table 4 below shows Novo Nordisk at the top with a gross margin of 81.8%, a slight decrease from 2019, which followed another price decrease in 2018. The biotechs rule pricing as they have ever since the first Pharm Exec Industry Audit in September 2002. But note the significant drop in gross margin average for our 18 pharmas in recent years, from 77.7% in 2018 to 68% in 2019, and for 2020, down to 67%. Nine firms were able to increase their gross margin in 2020, with Lilly, Novartis, Gilead, Biogen, and Amgen raising it the most.


Pre-tax income margin

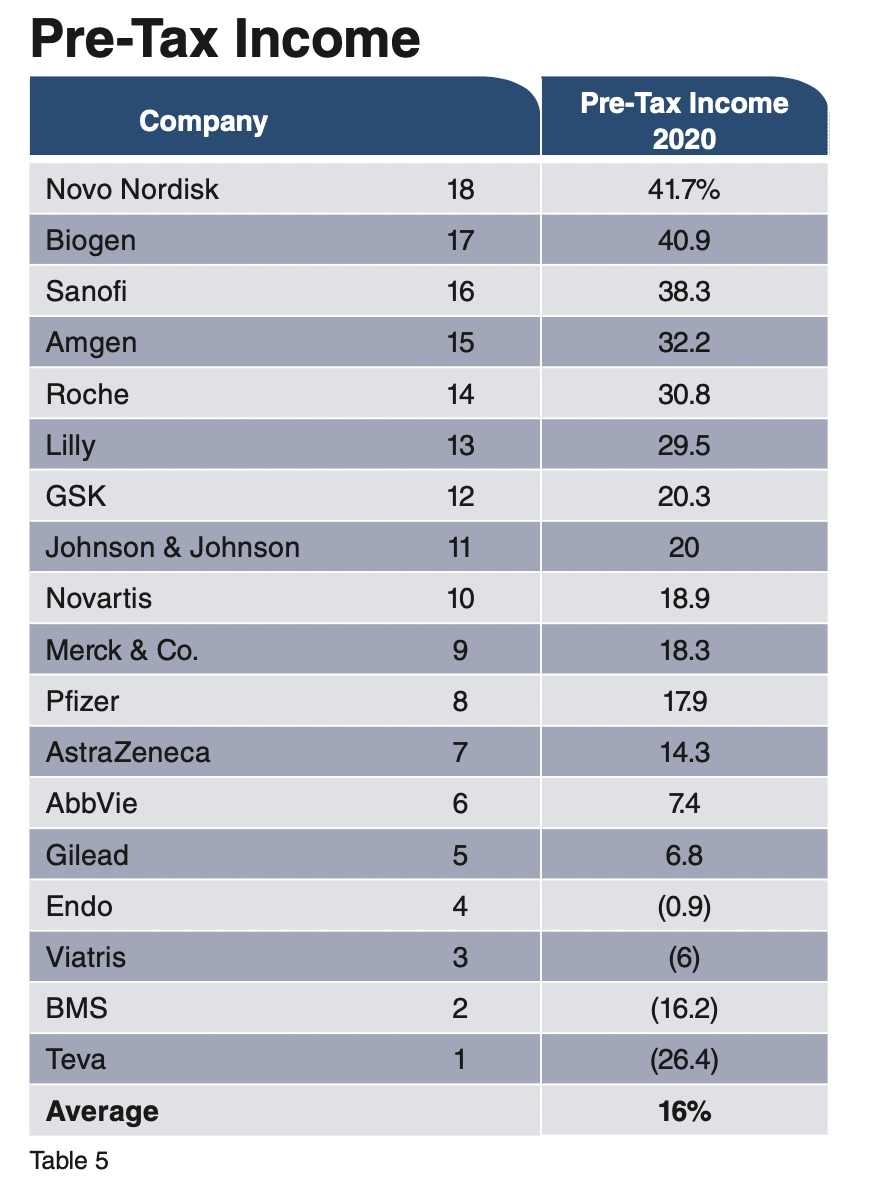

Staying with margin management, Table 5 shows pre-tax operating income, or profit to sales. Again, the higher the gross margin is, the more that contributes to improving pre-tax operating income. Operating income consists of total revenues minus cost of goods sold and minus operating expenses related to a firm’s typical business. It excludes one-time gains and losses, dividend income, and interest income.
At the top in this metric is Novo Nordisk with pre-tax operating income of 41.7%. The average figure for 2020 was 16%, a significant four-digit drop from 20.3% in 2019. Only seven of our 18 companies saw their pre-tax operating incomes increase for the year.
Sales to assets
Gross margin and pre-tax operating income have to do with margin management; sales to assets has to do with asset management. If a firm is at $70 billion in sales, for example, it won’t be doubling revenue anytime soon. If the company has also curtailed SG&A and disposed of assets, it won’t be cutting operating expenses in half anytime soon either. Then it turns to asset management to do a better job making use of, not necessarily owning, assets.
When you multiply profit to sales (pre-tax operating income) by sales to assets (asset management), you get a far more important measure: return on assets. A company can have a relatively low profit margin with a relatively high sales-to-assets ratio that will result in a better performance in terms of ROIC.

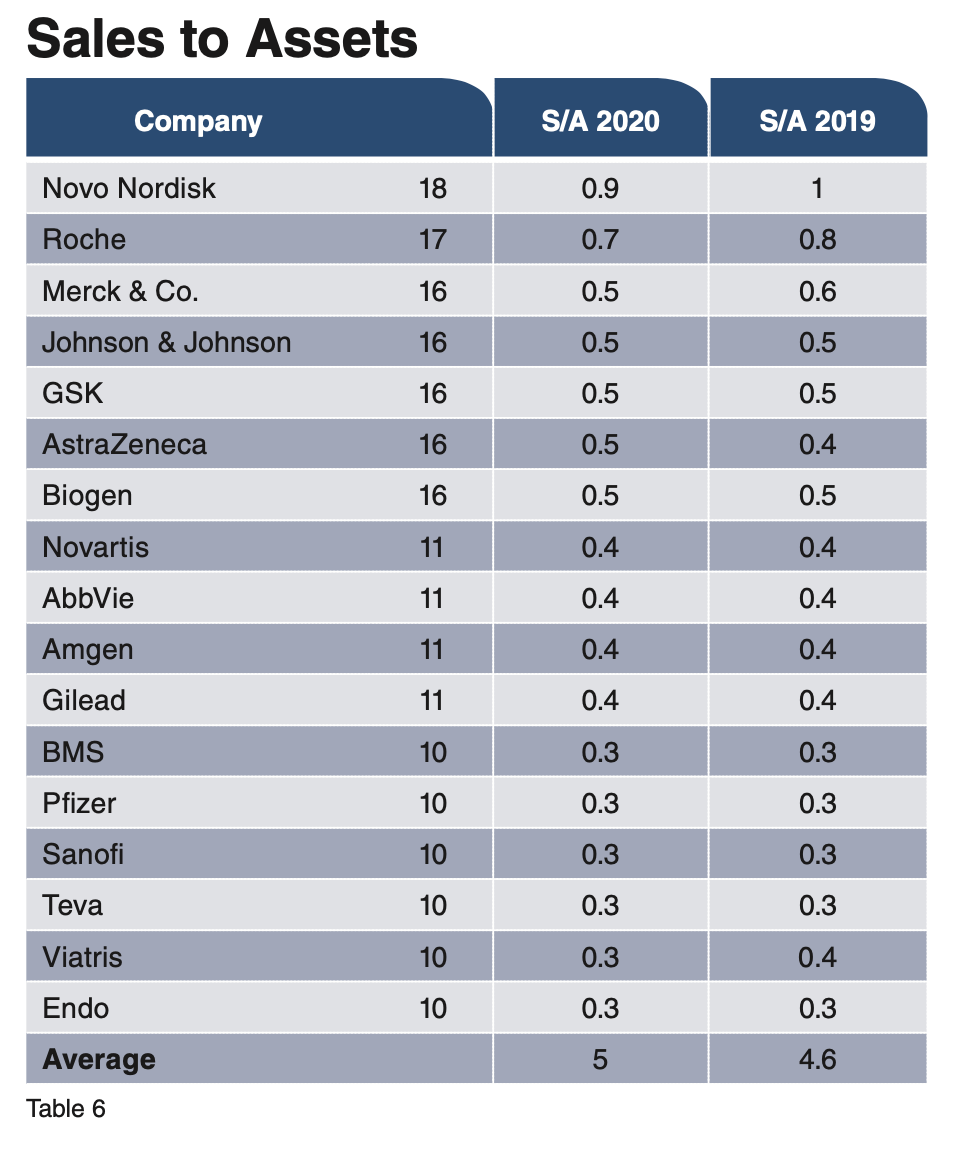

As seen in Table 6, Novo Nordisk’s sales-to-assets ratio is 0.9. For every dollar invested in assets, Novo Nordisk gets back 90 cents. Roche comes in at No. 2, getting back 70 cents for every dollar invested in assets. In our latest Audit, only three companies rank above average regarding how productive they are in managing their assets.
Return on invested capital
Now we come to the mother of all metrics: ROIC. ROIC is net income left over to shareholders as a percent of debt and common stock. According to longtime organizational consultant Mark Van Cleaf in The New York Times, the best measure of business performance is ROIC—how much is a company generating on its capital investments, plant and equipment, minus the cost of that capital, debt, and equity? Combine this with our relatively new addition to the Audit: weighted average cost of capital (WACC). According to Van Cleaf, management should be providing value that exceeds its cost of capital. For example, two organizations can have a ROIC of 10%, but company 1 has a WACC of 12% while company 2 has a WACC of 7%. The first firm is destroying shareholder value while the second one is creating shareholder value.
Prior to the mid-1980s, the conventional wisdom was that debt had a cost (the rate you pay for borrowing), but issuing stock was free. But what if the peer groups an organization competes with have a higher ROIC than the company? Even though the firm shows a profit, it is destroying shareholder value if its profit is below its peers’ average. What return could an investor get by investing in an organization of equal risk? This was the brainstorm of Stern Stewart, a consulting firm based in New York City.
Our source for WACC relies on three years of income statements and balance sheets to arrive at a firm’s WACC percentage.


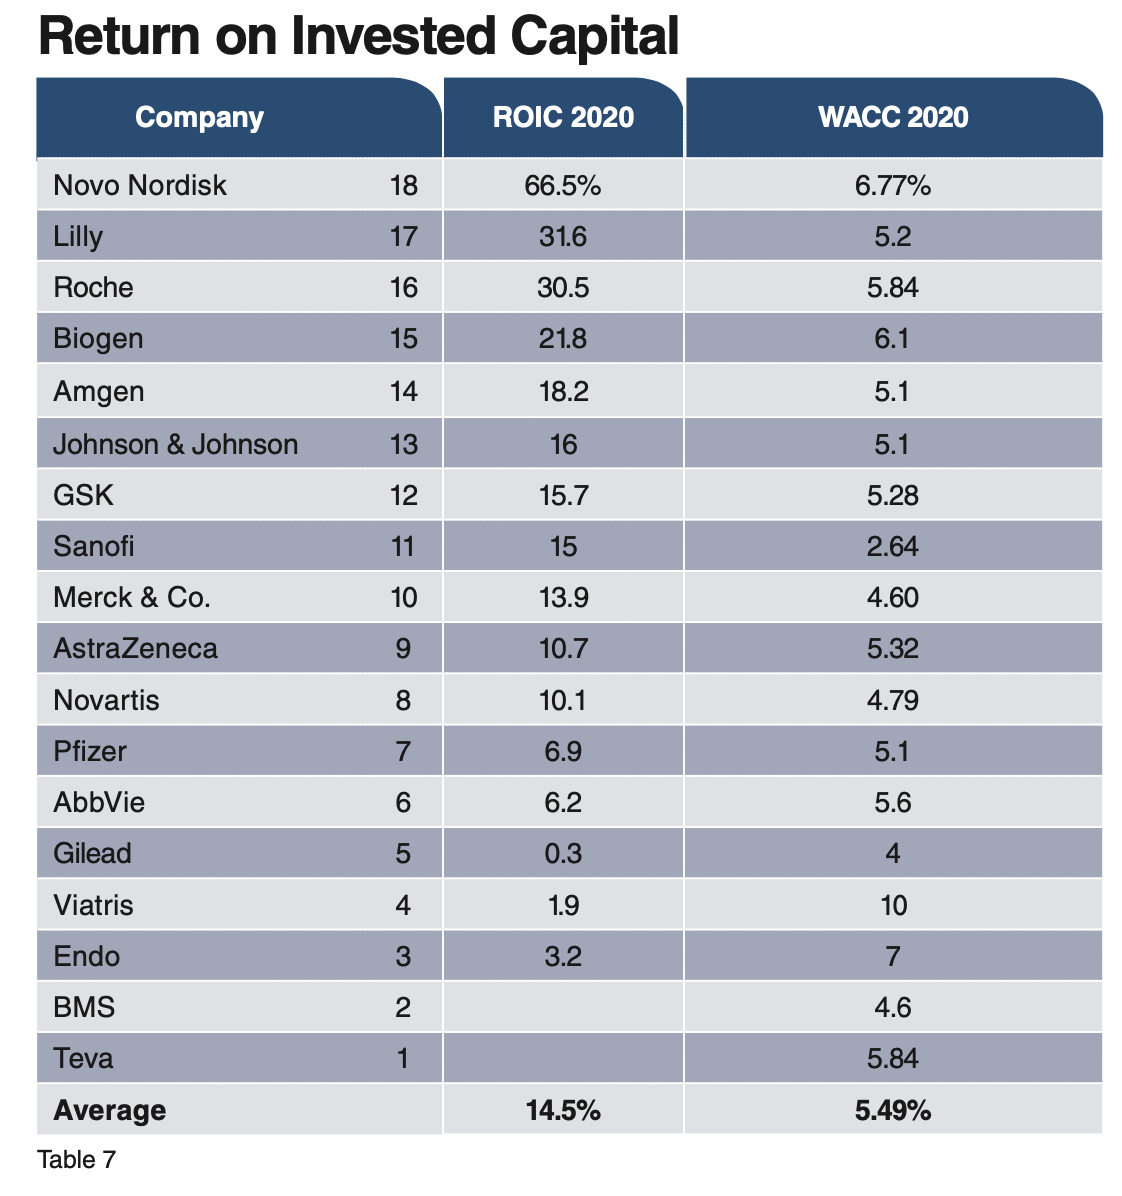
Table 7 below shows Novo Nordisk far out in front with a ROIC of 66.5%. Lilly ranks second at 31.6%. Average ROIC decreased to 14.5%, from 16.13% in 2019. Only one-third of our 18 companies increased ROIC for 2020.
To avoid overstating the impact of ROIC, and double-counting its value, we use the ROIC number to come up with the rankings on this metric. But the inclusion of WACC in Table 7 tells an interesting story: The greater the difference between ROIC and WACC, the greater the return to shareholders. Aside from Novo Nordisk’s outsized ROIC, the firm with the most impressive creation of shareholder wealth for 2020 was Lilly, with a 26.4-point difference between ROIC and WACC. Roche was next with a 24.5% differential.
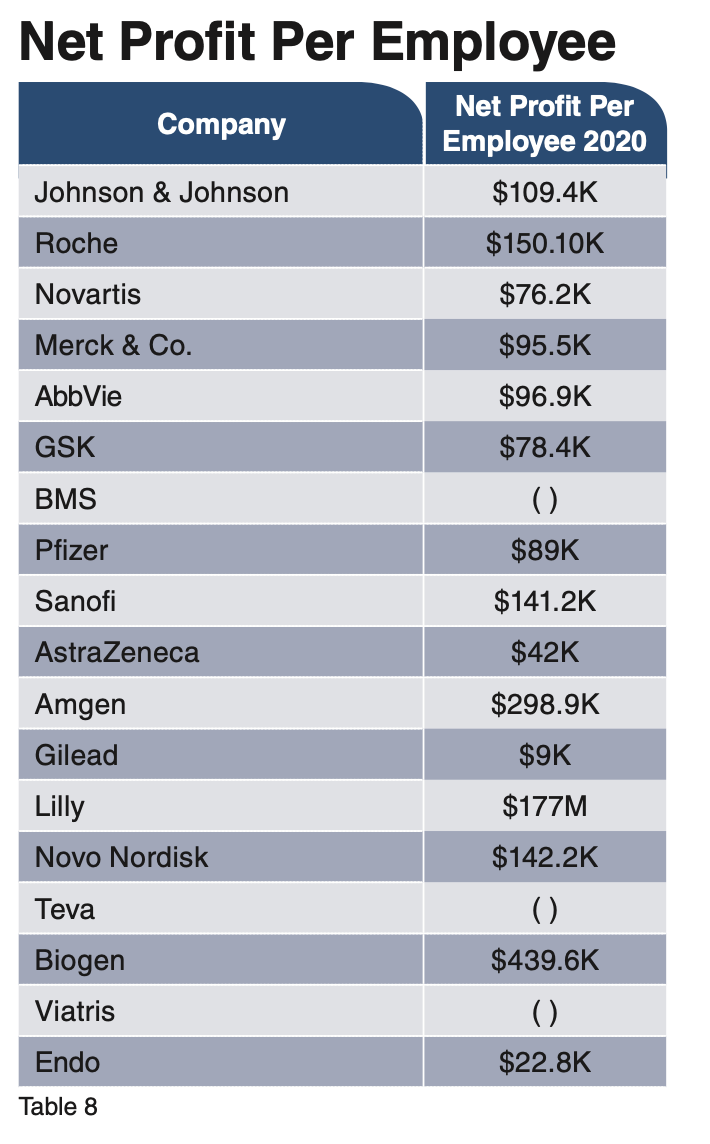
Net profit per employee
This metric is not weighted in the rankings. It is interesting, however, to show how profitable the pharma sector is. Biogen produces the most profit per employee of our 18 pharmas, at $439,600 per employee, as indicated in Table 8 below.


Selling, general, & administrative expenses to sales
SG&A (see Table 9 below) is another metric that does not impact the rankings. Nevertheless, it is still important because the expenses in this category are necessary to run an organization and constitute routine spending such as rent, salaries, advertising, marketing, legal, and more. Laying off and firing workers costs money in severance before it begins to pay off. It’s also important to keep in mind that this is a one-year comparison. A company can be making investments in advertising, training its sales force, etc., and that will pay dividends down the road. One swallow does not a season make.

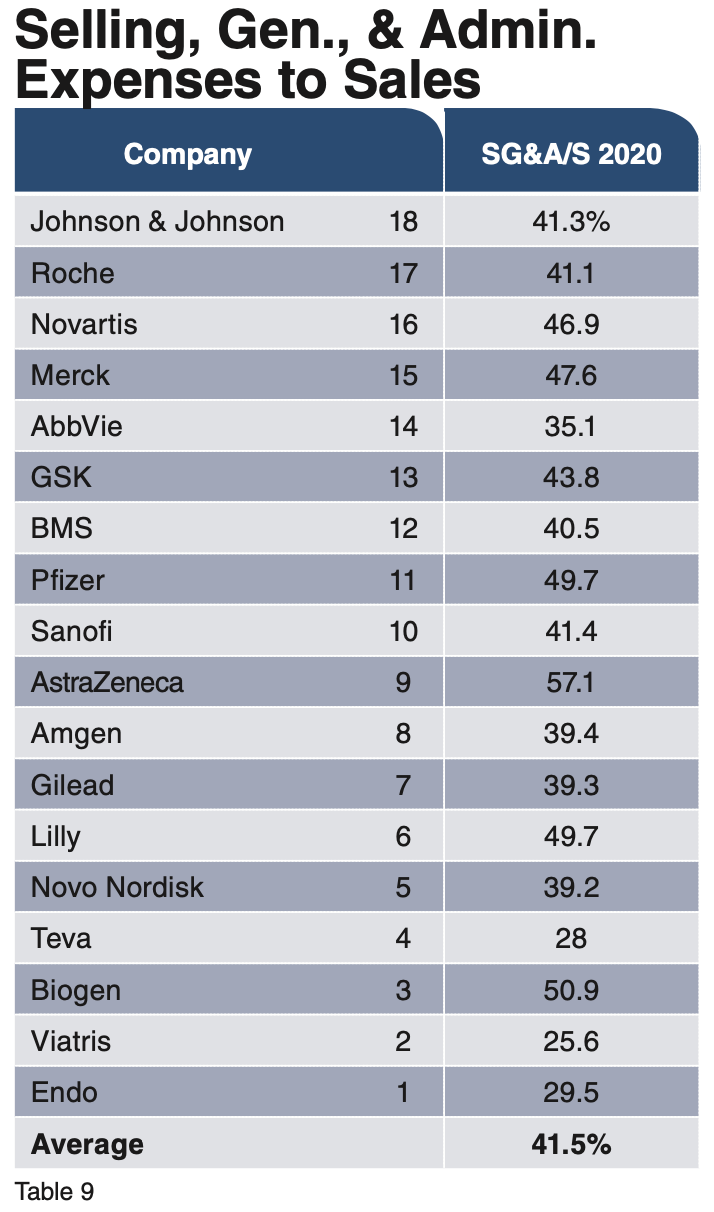

Opportunities exist to cut advertising costs by being more efficient with agencies and revamping supply chains. Also, SG&A can increase, but it is the goal for sales growth to grow faster, thereby lowering the SG&A-to-sales ratio. Ballooning overhead leaves a firm inefficient and less productive than it otherwise could be.
The average SG&A/sales ratio for 2020 is 41.5%, the same figure it was for 2019. Take, for example, AstraZeneca and its SG&A ratio of 57%, which is about 16 points higher than average. What if the organization could get its SG&A/sales ratio down to the average (41%)? That would result in about $2 billion that could be assigned to bringing a new drug to market, or returned to shareholders.
Audit standouts

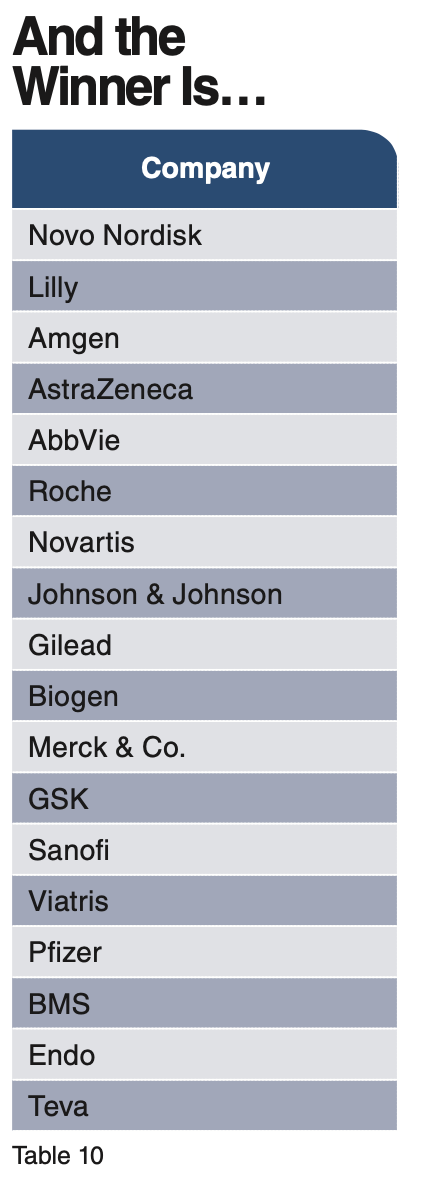

Table 10 reveals the winner of this year’s Audit: Novo Nordisk, which secured the top spot for the third consecutive year. Lilly finished a close second, followed by Amgen, AstraZeneca, and AbbVie rounding out our “Fab 5.”
Worth noting is the impressive run Lilly had in 2020. The drugmaker was the only company on our list to show positive growth in every one of the seven weighted metrics.
Finally, I want to return to a performance discussion we touched on in the past: The Dr. Bill Trombetta Hall of Fame for Outstanding Management Performance. In a few installments of the Audit over the years, we focused on two measures: profit to sales multiplied by sales to assets = profit to assets, a crude version of the more powerful performance metric ROIC. I want to go back to such a year-capsule evaluation but in terms of a new metric: The PSE Metric—profit grows faster than sales and sales grow faster than expenses (SG&A). I am calling this “Dr. Bill Trombetta’s Annual Pharmaceutical Executive Pharmaceutical Industry Audit ‘Trifecta.’”


What does it profit a company whose sales growth is exceeded by its growth in SG&A (overhead, burden)? And what if sales growth is lower than the growth in profits? Again, it would be unfair to penalize or reward an organization for its SG&A spend in a given year; the variable cost spend could be an investment that will pay off in the near future or a sign of overhead bloat.
But in a given year, if a company can grow its sales faster than SG&A spend and grow the organization’s profits faster than the growth of its sales, this is worth shouting out.
Sales should grow faster than SG&A spend over time. And profit growth should exceed sales growth. What does it mean if revenue grows faster than profit? It suggests that the company is profiting less from each dollar of sales revenue. Perhaps sales growth is growing in strategic business units or product lines that carry lower profit margins. It also could mean increasing competitive pressure.
Given the rationale above, here are Dr. Bill Trombetta’s top Trifecta Performers, in no particular order, for 2020: GlaxoSmithKline, Sanofi, AstraZeneca, Gilead, and Lilly. Hats off to these five pharmaceutical manufacturers for a well-managed financial performance for 2020.
About the author


Bill Trombetta, PhD, is Professor of Healthcare Strategy & Marketing at St. Joseph’s University Haub School of Business in Philadelphia. He can be reached at trombett@sju.edu


")

")


GSK Acquires Boston Pharmaceuticals’ Novel FGF21 Analog for Steatotic Liver Disease
May 14th 2025Under the agreement, GSK will acquire BP Asset IX, a subsidiary of Boston Pharmaceuticals, for up to $2 billion in total cash consideration, including $1.2 billion upfront and up to $800 million in milestone payments.

GLP-1 Surge Fuels 10.2% Rise in US Prescription Drug Spending in 2024, ASHP Reports
May 13th 2025Weight-loss and diabetes drugs dominated pharmaceutical spending last year, according to a new report by the American Society of Health-System Pharmacists, who warns of tariff-driven supply chain threats and continued growth in clinic drug costs.