2005 Industry Audit
Not surprisingly, the biotechs hold three of the top five rankings in percent of sales invested in R&D. Even more impressive, then, are the ratios for Big Pharmas like Schering-Plough and Eli Lilly, in third and fourth place, both at a bit more than 19 percent.
The pharmaceutical industry is usually characterized as elite in terms of outsized rewards and excessive profits. But continuing a subtle transition from last year, it's possible to see the vaunted industry performance starting to lose some of its luster, especially Big Pharma compared to other healthcare sectors. Growth stocks no more, Big Pharma— for now—reflects value, personified by the relatively high dividend yields from Merck and Bristol-Myers Squibb.
Overall global industry growth has slowed to single digit rates: 2004 global dollar volume was $550 billion, a 7 percent increase over 2003—which in turn represented a 9 percent increase over 2002. US sales grew to $235.4 billion, a growth rate of 8.3 percent compared with 11.5 percent growth from 2002 to 2003. The United States accounts for 46 percent of the world's pharmaceutical market, according to the most recent IMS data.
Comparing pharma to the stock market as a whole, the main market indices finished 2004 as follows:
Standard & Poor......... 9%
Nasdaq......... 8.6%
Dow Jones Industrials......... 3.1%
Dow Jones US Pharmaceuticals......... -10%
Just how far the mighty have fallen is shown by the fact that as recently as 1998, pharmas traded at 40 times Price to Earnings ratio (P/E). Today, pharmas trade at less than 17 times its P/E.


Bill Trombetta
As a whole, pharma placed 28 among the 42 industry groups tracked by Fortune; its 2003 to 2004 revenue growth of seven percent was less than the Fortune 500 median growth rate of 10.3 percent. Only pharmaceuticals, along with electronics and electrical equipment, telecommunications, and airlines, failed to post profit growth: The industry ranked 40 out of 42 with a negative profit growth rate of –5.2 percent compared with the Fortune median of 20.3 percent. Over the five-year period, 1999 to 2004, the pharmaceutical industry ranked 35 out of 44 industries, with a profit growth rate of 2.8 percent vs. the Fortune median of 20.3 percent during the same time period.
Here are some additional industry comparisons from the Fortune study:
Profit to Sales Pharma ranked third out of 47 (15.8 percent compared to a median of 5.2 percent).
Profit to Assets Pharma was 12 out of 47 (8.1 percent compared to a median of 4.1 percent).
Return on Shareholder Equity The industry scored a modest 16.6 percent (13 out of 46 industries) compared with a Fortune median of 13.9 percent.
Total Return to Shareholders Pharma ranked 39 out of 47 at 2.8 percent compared with a Fortune median of 15.5 percent; pharma shareholders would have done better with their money in a certificate of deposit last year.

Genentech
In Vivo magazine looked at growth in market capitalization from December 1999 through December 2004, breaking it down among six healthcare sectors. Big Pharma came in at the bottom:
Diversified (hybrid firms)......... 30%
Medical Devices......... 87%
Big Biotech......... 26%
Small Biotech......... 47%
Specialty Pharma......... 36%
Big Pharma......... - 24%
In market value alone, Big Pharma lost $153 billion in 2004.
An ironic twist regarding these figures: As In Vivo points out, Big Pharma at one time owned much of these sectors:
- Pfizer sold Howmedica (to Stryker in 1998)
- Lilly owned Guidant in 1994, when the company was spun off at a market capitalization of $1 billion; today J&J values Guidant at $25 billion
- BMS had Hall Surgical and Linvatec.
THE TOP SIXTEEN PUBLICLY TRADED PHARMACEUTICAL COMPANIES
Pharm Exec's fourth annual strategic Industry Audit analyzes the 2004 financial performance of 16 companies that are publicly traded on stock exchanges and file 10-K reports with the Securities and Exchange Commission (or 20-F reports, in the case of foreign companies).


Amgen
As in past years, the audit goes beyond standard accounting and financial statements to assess company performance. (See "Industry Audit," Pharm Exec, September 2002, 2003, and 2004.) It takes into account new marketing metrics, such as sales per domestic rep, and percentage of revenues coming from new products that were not on the market five years ago. The information in this report was gathered primarily from 10-Ks and 20-Fs . Databases, such as Yahoo! Finance.com and secondary sources, such as Fortune, Forbes, BusinessWeek, In Vivo, and Pharmaceutical Executive were consulted.
Universe Because the goal is to compare companies' performance, this report omits a few companies that are (or in some cases, appear to be) publicly traded but are not comparable with the rest of the group: extremely diversified companies in which pharmaceuticals are not clearly dominant (such as Baxter Laboratories), extremely narrow-focus companies (such as Novo Nordisk), companies that manufacture primarily generic drugs (such as Teva), companies with unconventional ownership structures (such as Roche), and companies whose financial reporting doesn't live up to US and European standards (such as many Japanese companies).

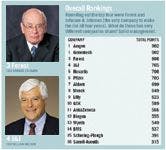

Overall Rankings
Methodology To arrive at the "Fab Four" and the Company of the Year, the following methodology was used. Companies were assigned scores based on their rankings in 15 key metrics—16 points for first place, 15 for second, and so forth. These scores were weighted by relative importance; thus, Enterprise Value to Sales and Growth in Enterprise Value, along with Percentage of Revenue from New Products were weighted the highest at 7. Mid-metrics such as Gross Margin and Return on Invested Capital (Debt and Equity in the denominator) were weighted 5. Metrics such as Profit to Sales and Price to Earnings, albeit important, can be easily manipulated and easily managed through "smoke-and-mirrors" accounting/financial manipulations. So they were weighted 3.
For example, the highest Enterprise Value to Sales ratio was achieved by Genentech at 18.33, which gave Genentech 16 points for this metric. Weighted at 7, Genentech got a total of 112 points on Enterprise Value to Sales (16 x 7). Forest came in 10th so its total points on this metric were 49 (7 x 7), and so forth. Then all scores over all metrics were summed to arrive at a total number. The highest to the lowest scores were then ranked.

Metrics The following 15 metrics were used to determine each company's total score:
- Enterprise Value, 2004 Versus 2003
- Enterprise Value to Sales
- R&D Spend
- R&D to Sales
- Earnings Per Share
- Price to Earnings
- Growth
- Gross Margin
- Profit to Sales
- Sales to Assets
- Profit to Assets
- Assets to Net Worth
- Profit to Net Worth
- US Sales Per Domestic Rep
- Sales Per Employee
- Percentage of Revenue From New Products
- Return on Invested Capital
Other rankings, such as prescription sales and R&D spend, are presented in graphic form but were not included in the final score.
Readers who feel comfortable with the full range of business metrics may want to head straight for the charts. For others, here is a summary of how the various numbers are calculated, and why they matter.


Enterprise Value (EV) 2004 Versus 2003 Enterprise value is a relatively new metric that has become popular because it includes the impact of a firm's debt on its capital structure. It is calculated as follows: Market cap plus net debt divided by EBITDA (earnings before interest, taxes, depreciation, and amortization). Net debt is a company's total debt minus its holdings of cash and marketable securities. Enterprise value is arguably the acid test of all metrics because it focuses on shareholder value: EV reflects what a buyer would have to spend to buy the enterprise. Sanofi-Aventis has no horse in this year's race, because there is no point of comparison. The winner was Genentech, with a growth of more than 56 percent, followed by Abbott, J&J, Wyeth, Amgen, and Schering-Plough. But note the negative growth in enterprise value for AstraZeneca, Lilly, Pfizer, Forest, Merck, and Biogen. For these pharmas, shareholder value was destroyed.


Enterprise Value to Sales This metric is the equalizer, the normalizer. One would expect a huge operation like Pfizer to have an absolutely large EV number, just as Muhammad Ali at 210 pounds stood head and shoulders above all heavyweight fighters. But pound-for-pound, arguably the best fighter of all time, at middleweight 160 pounds, was Sugar Ray Robinson. Analogously, EV/Sales normalizes this assessment. And we see that the biotechs with the lowest sales volume are the highest values among the Big Pharmas. And big things are expected from Sanofi-Aventis, which came in fifth.
R&D Spend to Sales As with enterprise value, major pharmas like Pfizer and GSK are expected to spend more in absolute dollars than smaller competitors. So R&D also needs to be normalized to show who spends more in proportion to their sales. Not surprisingly, the biotechs hold three of the top five rankings with the highest percentage of sales reinvested in R&D. Even more impressive, then, are the ratios for major pharmas like Schering-Plough and Lilly in third and fourth, both at a bit more than 19 percent.


Earnings Per Share (EPS) and Price to Earnings (P/E) These are bellwether financial performance metrics, but they are easily manipulated, so they carry the lowest weighting.
Growth You grow or you die, so this is an important metric. The better way is to grow organically, internally, rather than the Tyco way: buying everything that isn't nailed down. It seems that some pharmas merge and acquire to make a tortured fit on earnings and sales projections, while others seem to merge and acquire to make more strategic fits, like J&J's acquisitions of Alza, Centocor, and—maybe—Guidant.
Gross Margin This metric says a lot about how good a company is at pricing. The higher the gross margin the better. Note Forest, which had to come in at a discount with Lexapro (escitalopram), a me-too drug to Celexa (citalopram), and yet its pricing is strong—coming in at about the same level as Merck, Lilly, and GSK. Surprisingly low is Abbott. One would have thought after jettisoning its hospital supply subsidiary, Hospira, with its lower margins, Abbott's gross margin would have improved.


Profits to Sales (P/S) Profit margin measures how good a firm is at margin management. It shows, after subtracting the cost of goods sold, what is left after gross margin to cover operating expenses and contribute to net profit before income taxes. P/S is another metric that can be manipulated through smoke-and-mirror accounting/finance machinations, but it is still important. Forest comes in at number one, a tribute to its marketing prowess. Forest has a high gross margin, despite having to discount an undifferentiated drug, and the company appears to have strong control of its operating expenses to come in at number one on P/S. Genentech, number two in gross margins, is in the middle of the pack in this metric. Merck's shedding of the Medco baggage vastly improved its operating margin.
Sales to Assets (S/A) This is an extremely important ratio. It shows how efficient and productive a firm's operations are. For example, the average for the 16 pharmas in this report is 52 cents. That means it takes $1 of assets to generate 52 cents of revenue on average for these companies. The higher the ratio, the better a firm is at using—not owning—its assets. It is fascinating to observe that the three so-called biotechs (Amgen, Genentech, and Biogen) are all in the bottom half—and two are in the bottom quartile—at using their assets productively.


What The Dupont Long-Term Return-On-Investment Model Tells Us
Profit to Assets (P/A) When you multiply Sales to Assets by Profit to Sales, you get Profit to Assets, or return on assets—a much more meaningful metric. Here is where Sales-to-Assets turnover productivity pays off. For example, J&J is only number seven for Profit to Sales but its strong showing in Sales to Assets places the company at number two for Profit to Assets.
Assets to Net Worth (A/NW) Assets to Net Worth is used to calculate other metrics. Unweighted in the audit, it measures how much debt is in a firm's capital structure. The higher the ratio, the more aggressive a company is in using debt in its capital structure. As can be seen from the chart , the drug industry is extremely conservative when it comes to using debt. These ratios are very low. The author has more debt on his personal credit card than do Forest and Biogen. This is an industry that has not needed to go to the equity markets or borrow money to grow—up until now anyway. The last time a major pharma had to go to Wall Street seeking additional equity was sometime in the mid–1970s; the firm was Abbott. This ratio does have meaning, however, when we incorporate it into the Dupont Long-Term Return-on-Investment Model to arrive at Profit to Net Worth.


US Sales Per Domestic Rep
Profit to Net Worth This metric is affected by the amount of debt in the capital structure. With more debt, Return on Net Worth is leveraged upward. At the top of the list are Merck and J&J, but Forest follows close behind.
US Sales Per Domestic Rep This metric reflects the productivity of the sales force. The methodology used to calculate this ratio started with total drug sales. That number was adjusted for domestic US sales and then divided by number of US reps. The very high sales productivity of the three major biotechs can possibly be explained by their relatively small sales forces combined with relatively high prices for big molecule drugs. Schering-Plough's numbers should improve as its sales force has more drugs to sell by taking on Bayer's drug lines.


Sales Per Employee
Sales Per Employee In addition to sales per rep, the overall productivity of a company's employees is worth noting. Is the company top heavy? How efficient is the firm in terms of its entire employee base? This ratio is similar to Sales to Assets in that employees are assets. Again, the three biotechs' employee productivity places in the top quartile. And as noted in the previous table, Schering-Plough's ratio should improve with taking on Bayer's drug lines.
Percentage of Revenues From New Products This very important metric was first introduced in the mid–1970s, when a new management team turned around Black & Decker. One of the metrics they revitalized was percentage of revenue coming from products that were not on the market prior to the most recent three years. For this report, drugs that were approved between 2000 and 2004 and that had minimum sales of $300 million for 2004 were included in calculating this ratio. Forest's ratio is a bit misleading because of its reliance on one drug, Lexapro, that was in-licensed from Lundbeck.


Return on Invested Capital (ROIC) tracks Return on Shareholders' Equity but will always be a bit lower since it includes debt in the capital structure as well as shareholders' equity. It is a more meaningful metric than shareholders' equity because return should cover the entire cost of capital, both debt and common stock. It is apparent from the ROIC table that a number of firms are not covering their cost of capital, or WACC (weighted average cost of capital). The average return on shareholders equity for the industry is 17 percent. Anything lower than, say, 20 percent, would most likely not be enough to cover the cost of capital.
The Winners Circle
For the first time in the four years of dong the annual strategic audit of the pharmaceutical industry, we have a tie. Amgen and Genentech share first place, followed by Forest and J&J.
The results may be a bit misleading. Though Genentech and Amgen had the same final score, they are very different companies—and this was in many ways Genentech's year to shine. Look at the data: Amgen has more sales, and scores well on a number of other metrics, but fascinatingly, Genentech's enterprise value is greater. The market is saying that this company has a great future ahead of it. You can see the same phenomenon elsewhere. Microsoft has annual sales of $20 billion to IBM's $80 billion, but Microsoft's valuation is ten times higher. It's all about Bill Gates' brain.
When you think about the future, there are questions about Amgen. The company had to buy Enbrel (etanercept). And the rest of its product line consists mostly of Epogen (erythropoietin alfa) and Neuopgen (filgastrim)—and two reformulations of those important products. Genentech, meanwhile, is going like wildfire. It has some negatives—it stumbled getting into rheumatoid arthritis and psoriasis—but overall the perception is one of great strength.
J&J is always there. This is the fourth year of this report, and Johnson & Johnson has been there all four years—as well as on the Fortune and BusinessWeek lists of top companies. It has been a solid performer for a hundred years. What's most exciting about J&J today is the notion of making products that are more like services—putting drugs, diagnostics, and devices together. Roche was there first. But J&J has been present all along too. Stents, orthopedic products, healthcare management systems—they're doing a good job of putting together the whole package of solutions.
Forest is a sort of one-trick pony but excellently managed. The company doesn't waste money on DTC. It doesn't spend an extra nickel on R&D, its science may not be cutting-edge, but Forest is focused and formidable in the way it executes.
These top companies are a reminder that there are many ways to achieve success in pharma, but strong, smart management and execution are the core of all of them. That's a lesson more companies will need to learn in the years ahead.
Data provided by Bill Trombetta, professor of pharmaceutical marketing and strategy at the Erivan K. Haub School of Business at St. Joseph's University in Philadelphia. He can be reached at dtrombet@aol.com


The Misinformation Maze: Navigating Public Health in the Digital Age
March 11th 2025Jennifer Butler, chief commercial officer of Pleio, discusses misinformation's threat to public health, where patients are turning for trustworthy health information, the industry's pivot to peer-to-patient strategies to educate patients, and more.


Navigating Distrust: Pharma in the Age of Social Media
February 18th 2025Ian Baer, Founder and CEO of Sooth, discusses how the growing distrust in social media will impact industry marketing strategies and the relationships between pharmaceutical companies and the patients they aim to serve. He also explains dark social, how to combat misinformation, closing the trust gap, and more.