
|Articles|May 15, 2017
Meaningful Insights with Graph Technology
Author(s)Emil Eifrem
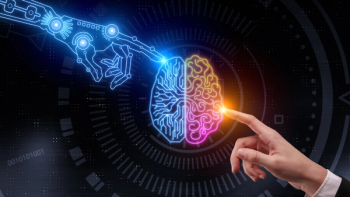
Emil Eifrem examines how life science researchers can uncover new insights using the in-built power of graph technology.
Advertisement
Emil Eifrem examines how life science researchers can uncover new insights using the in-built power of graph technology.
The emergence of big data, together with advances in data science approaches and technological innovation, have provided the pharma industry with the opportunity for valuable, previously unobtainable insight that has the potential to improve all of our lives.
Real world data however comes in different and highly unstructured formats. This means that big data life science research must surpass simplistic managing, analysis and storage of data and find new ways to achieve its objectives. This has resulted in re-visiting the tools historically utilized for the purpose, including SQL and relational database technology.
Unfortunately traditional relational database methods can’t cope with the volume, as well as the inconsistent data. Medical data by its nature is very heterogeneous. It can run from cell-level to detailed data to macro-scale disease network tracking – all in the same research. Often scientists want to link either end of the spectrum as that is where the interesting results can lie. But it is a real challenge to model this. Especially as the reality is that relationships in data conceal the actual breakthroughs. Graph database technology, however, has appeared as a viable and powerful alternative. Graph databases are already being used by Internet giants, including Google, Facebook and LinkedIn.
Unlike the relational database, which stores data in rows and columns, graph databases connect data points in unstructured big data, essentially joining the dots to create a picture of the relationships between them. These data patterns are difficult to detect using SQL-based rdbms or other approaches, such as NoSQL and Hadoop.
The power of graph databases hit the world stage when it was revealed that the technology was behind the world’s largest investigative journalism project, dubbed The Panama Papers. A team of global researchers went through a gargantuan 2.6 terabyte data set that would have been an impossible task using traditional database technology.
High-volume, highly-linked datasets like those researched in the Panama Papers are too difficult for SQL to easily work with. This is down to the architecture. Relational databases model using sets of tables and columns, carrying out complex joins and self-joins to action queries when the data becomes increasingly inter-related. But the questions that need to be asked in areas such as Life Sciences are technically challenging to construct and expensive to run in this form, while making them work in synchronous time is a challenge, with performance degrading as data volume grows.
As human beings we look to model connections between data elements visually, building up an intuitive model. The relational data model does not match our mental visualization of the problem, technically defined as “object-relational impedance mismatch”. Trying to take a data model based on relationships and pushing it into a tabular framework, the same way a data platform like a relational database does, ultimately creates disconnect that can not only cost valuable time, but can also lead to missing potentially useful patterns and leads.
Medical and pharma use cases rise
The unique selling point of graph database technology is its innate ability to discover relationships between data points and understanding them – and at huge scale. Joining up the dots, if you like. That is why it is an exciting tool for medical researchers, enabling them to uncover hidden patterns when they are delving into the difficult problems, like new molecule research and big clinical trial work.
Data provenance, of course, is pivotal here as it is invaluable to understand exactly where data has been sourced, what it might be affecting and the link between its extra connections. Graph technology is adept at capturing this.
Data scientists are increasingly becoming graph database converts in their examinations of big data. Take
Monsanto is running ongoing research into best possible plant varieties and what genetic traits allow them to thrive in different climatic and environmental conditions. There are genetic patterns that require a dataset to be visualized as a family tree. Williamson and his team had previously used traditional relational database methods, which were extremely time consuming and did not scale. Williamson, however, recently discovered that family tree data sets naturally work as a graph database, leading analysis to take minutes instead of hours.
Another senior scientist,
Novartis wanted to establish one database to look at how it can use its vast scientific knowledge to develop the next generation of medicines. Graph has allowed Novartis to flexibly navigate all of these data sources, which is a huge boon to its research.
Or take the RU FP& HOMAGE consortium, which is looking at early detection and prevention of heart failure. A large dataset consisting of information from 45,000 patients from 22 cohort studies covering patient characteristics, clinical parameters such as medical history, electrocardiograms and biochemical measurements, is being connected with existing biomedical knowledge in public databases. This is being utilized to develop an analysis platform so implicit and explicit relationships can be more easily pulled out and explored. If you consider that the graph database for just one heart failure network analysis platform contains over 130,000 nodes and seven million relationships alone, you will understand that this is a very complex task.
The deep dive into big data
As interrogating data and knowledge in life sciences requires the modelling of an incomplete model of how our bodies work. A model that is always in flux. It is essential we find a better way to model that complexity to speed up research. As our knowledge pool expands, so these models change. Take DNA sequences, for example. Once thought to be a mass of unusable data they are now a key component of our genomes.
Many researchers and data modelers in life sciences have recognized that graph technology, due to its innate ability to model complexity, scale and connections is the go-to tool for serious medical research.
Further input from developers to build graph-based data structures for research will undoubtedly drive this forward, enabling a large number of highly trained specialists to have access to data in a form they can work with much earlier in their research.
In data everything is connected, but sometimes the connections display themselves as seemingly unknown. Having the power to dive deeper and make the unknowns known, uncovering the potentials in real-world data, is a compelling tool in life science research – and one that, although still very much in its infancy, is already having an enormous impact on the industry.
Emil Eifrem (
Advertisement
Related Content
Advertisement


Advertisement
Advertisement
Trending on PharmExec
1
Why High-Risk Patients Still Need Antivirals: Q&A with Gurinder S. Sidhu, M.D.
2
How Exposed is The U.S. Pharmaceutical Supply Chain to China’s Updated Export Control Regulations?
3
A Patent Strategy Pharma Execs May Be Overlooking: Means-Plus-Function Claims
4
Pharmaceutical Executive Daily: Bristol Myers Squibb Expands Partnership with Nvidia
5