12th Annual Pharmaceutical Industry Audit
With revenues down and margins squeezed by a realigning payer pool, the power to price above the market is the ticket to the top-no discounts allowed.
It's way too soon to break out the bubbly to celebrate the apparent recovery in pharma's innovation pipeline and the leveling down of history's steepest patent cliff. The limitations of the traditional industry business model no longer represent a temporary phase, to be papered over by the appeal of a bumper crop of new product introductions. Something more profound, and permanent, is at work. The assumption that good medicines will find markets with the appropriate push from a blitzkrieg of promotional firepower is yielding to a mindset in which novelty ranks a distant second to another, more bracing metric: impact.


GETTY IMAGES/SPXCHROME; GETTY IMAGES/TRAFFIC_ANALYZER
Unless a new drug can evidence real progression against the current standard of care, market uptake is likely to proceed at a snail's pace. Many therapies are finding that registration by itself is a false window where access to live, paying patients is concerned. Numerous additional hurdles now block the way to all those covered benefit lives. These range from practice-driven clinical treatment guidelines that drive formulary coverage to post-approval risk management obligations to health economics.
Significantly, none have much to do with scientific innovation, the traditional benchmark of industry success. Each relies instead on stakeholder or societal value, reflected in the incremental cost of therapy, as the decisive criteria in allocating resources stretched by the demographic burden of an aging population, which also happens to be less productive in generating the government taxes that fund a rising proportion of healthcare services. Hence the margin for error in meeting these "value" expectations is very thin.
In this destabilizing environment, companies must do three things to maintain the growth that shareholders expect. The first is to discern: what matters most to providers and patients in those therapy areas where you choose to engage? The second is to differentiate, with a proposition that transcends the existing competitive set—not simply by demonstrating superior clinical or product characteristics, but also with process, delivery, and service innovations that carefully define the disease category and the mix of patients able to access the drug. The third is to document, at an early stage of drug development and extending well beyond registration, that evidence which is most clinically relevant in securing a positive treatment outcome, one that gives payers a clear path in allocating their limited pharmacy spend.
Even if a company succeeds on all three scores, revenue growth—and the higher margins that once seemed to follow in tandem—is not a given. The opportunities presented in today's market for medicine tend to be short-lived and are subject to constant challenge because there is so much new competition, often coming from adjacent sectors like bioengineering and retail. This model is the antithesis of the still dominant approach to business innovation in Big Pharma, where large, expensive R&D projects dependent on fixed overhead are spun out over long periods of time. Innovation today takes a different form: when you can't anticipate market cycles precisely and the motivations of your customers and the competition are unclear, there is an advantage in being able to scale up a new idea quickly or, alternatively, to abandon it just as fast.
In other words, today's race to the top of the league charts belongs to the swift, where you claim your destiny by controlling the ability to price. That's the signal message in our 12th Annual Industry Audit of the highs and lows of performance among 24 of the largest publicly traded companies prepared by Professor Bill Trombetta of the St. Joseph University Haub School of Business.
—William Looney, Editor in Chief.
The Pharm Exec Industry Audit holds a unique position in the increasingly crowded field of data sets tracking industry performance. First published in 2002, the audit adheres to a simple objective: to identify how well companies are doing in advancing shareholder value. It is a measure open to interpretation, particularly because there is no other standard accepted reference point that looks at performance from this perspective. Also, our approach is idiosyncratic, but it does reveal the importance of metrics that often escape the attention of the major investor rating institutions. One example is the return on assets against profits, which allows for the valuation of intangibles like patent holdings. Shareholder value is also a good indicator of long-term success because of its association with stability; when the investment community is happy, there is less pressure for changes in the c-suite and management has some leverage to place riskier bets on investments that may play out only over time.
Methodology: eight benchmarks
The 2012 scorecard relies on data from the 24 companies' 2011-2012 reporting periods. As in years past, we rely on eight metrics to assess performance: sales growth; enterprise value growth; enterprise value to sales; gross margins; earnings before interest, taxes, depreciation, and amortization (EBITDA) to sales (a key measure of profit margin); sales to assets (or asset turnover); EBITDA to assets (a measure of the profitability of individual assets); and sales to employees (a ratio to assess productivity). Each metric is weighted, with the highest score of three given to enterprise value growth; enterprise value to sales; and EBITDA (profit) to assets. The other five metrics are weighted at two.

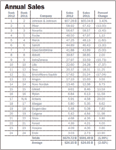

Annual Sales
The higher a company scores on each metric, the better the performance. For example, when a company ranks 1st on a metric, that is the highest achievement. Each ranking is then multiplied by a weight to arrive at total points. For example, if a company comes in 1st on enterprise value to sales, that ranking (24, reflecting the number of companies in the audit) is multiplied by a weight of three for that metric, resulting in a score of 72 points. Each company's data is then compiled over the eight metrics along with their respective weights to arrive at a total number of points. The company with the highest point total achieves the status of top performer for the year.
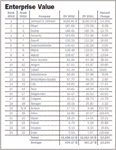
Enterprise Value
We also include one metric that is not weighted: sales, general, and administrative (SG&A) expenses to sales. SG&A is a statistic that by itself is neither good nor bad. If a firm is growing, launching new products, and entering new markets, then a rise in SG&A is good. The problem is when SG&A grows faster than sales or profits. Over time, this reflects a bloated overhead structure and operational inefficiencies.
The great revenue divide
A good way to start any industry evaluation is benchmarking it against the overall macroeconomic picture. We do this based on the real GDP growth rate in what is still pharma's largest single market: the United States. US GDP last year was modest, rising about two percent. The surprise is the US pharmaceutical industry fared worse, with IMS Health reporting that revenues fell into negative territory for the first time in 50 years. Factors behind the drop included post-recession strains on public budgets and private-sector employment as well as the steepness of the patent cliff from 2010-2012, when iconic blockbusters like Lipitor went off patent. The contrasting performance between expanding GDP and shrinking industry revenues marks the end of the historic trend line that left drug industry sales immune from broader economic pressures.


Audit Data Sources & Table Key
On the more narrow measure of returns to shareholders, while the Dow Jones Industrial Average was up 15.2 percent, the pharmaceutical index trailed this indicator as well, rising only 10.8 percent in 2012. Healthcare services and biotechnology shares performed relatively better, increasing by 17 and 41 percent, respectively.
These trends are bolstered by the audit's analysis of sales revenues for our 24 target companies, which ranged from top-ranked Johnson & Johnson, at more than $67 billion, to Endo, in last place, with sales of slightly more than $3 billion. The key marker here is revenue growth, which is a critical signpost of success in a climate where market pressures are conspiring to limit gains derived from price increases on existing products. Who is growing and who is not? Are companies introducing new medicines and expanding the customer base at the same time? There is an apt analogy in Woody Allen's cutting comments to Diane Keaton in the classic 1977 movie "Annie Hall." "Our love is like a shark. A shark has to stay in constant motion or it dies. What we got here is a dead shark." The larger message: a shark is a predator and can never relax; the choice is either kill and grow, or be eaten.


Unfortunately, the read from the 24 suggests an industry that is literally dead in the water. The Annual Sales table shows average growth for the group fell to negative two percent in 2012; no less than eight companies—all from Big Pharma—were in the negative, led by BMS at minus 17.04 percent, followed by Astra Zeneca (-16.7) and Pfizer (-13.0). Again, it was the 16 smaller, more nimble "stealth pharma" companies that occupied all the positive territory, with Actavis growing the fastest, at 29 percent, thanks to the acquisition of the Watson generic business. Celgene also appears solidly positioned for continued growth, with portfolio depth in important areas like oncology.
Enterprise value growth
Despite the negative sales growth, overall enterprise value in the 24 rose by 13 percent, as shown in the Enterprise Value table. To put these numbers in perspective, according to Forbes magazine the average major league baseball team posted enterprise value growth of a little more than 23 percent in 2012, or almost twice the average for our pharma 24.

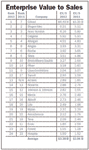
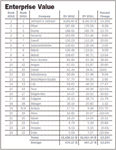
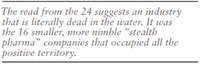
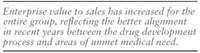
Enterprise Value to Sales
Gilead exhibited enterprise value growth of nearly 120 percent, followed by Actavis, at 101 percent, and Novo Nordisk, at slightly more than 38 percent. Gilead is a mainstay on the list for its record of operational efficiency, but also has benefited from the increasing mandated access to HIV medicines worldwide. Actavis is on an improvised, non-organic growth curve due its combination with Watson Pharmaceuticals in 2012, making it the world's third largest generic manufacturer, a record slated to be compounded further by the planned tie up with Warner-Chilcott.


Gross Margin
One disconcerting sign of the times is the spinoff of pharmaceuticals from companies that are hybrids, based on the rationale that the assets remaining will actually be valued higher by Wall Street. Recent examples include Covidien throwing off its Mallinckrodt drug arm and Abbott's jettisoning its drugs business to pursue bigger margin, high growth areas outside of pharma. The new Abbvie's stock spinoff, at $56 billion in market cap over annual sales of $18 billion, yields a market cap to sales ratio of about three to one—less than the enterprise value to sales average among our 24 companies. This suggests marketers have lower expectations for the new company's long-term growth and earnings.


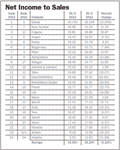
Net Income to Sales
Enterprise value to sales
This is a critical financial metric. The higher the ratio here, the assumption is there is additional forward momentum—the company is just getting started; the sky's the limit. A low ratio suggests the opposite: a company's best growth prospects are behind it; its stock value lies more in the smaller benefits associated with funds for widows and orphans. The Enterprise Value to Sales table shows that the metric has increased for the entire group, reflecting the better alignment that has taken place in recent years between the drug development process and areas of unmet medical need. Gilead again cut a big swath through this ratio, nearly doubling its performance compared to 2011. There was also outstanding performances by Novo Nordisk and Biogen-Idec.


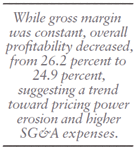
Gross margin
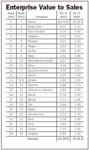
Gross margin reflects pricing power, as expressed by the ability of a company to secure a generous mark up for its goods. The higher the margin, the more pricing power a company has in hand. Obviously, management never wants to see those margins go down. In a recent Fortune magazine piece, columnist Janice Revell recounts the iconic investor Warren Buffett's wisdom regarding pricing: "The ability to hike prices is the single most important factor to consider when evaluating a business." Vadim Zlotnikov, chief market strategist at AllianceBernstein, told Pharm Exec, "pricing power is the key to sustainable earnings growth. There is clear evidence that shares of companies with pricing power dramatically outperform their peers." This is buttressed by the 12 years of audit results, where our "Fab Five" of consistently top performers share a common characteristic of nosebleed pricing prowess.
Overall, as seen in the Gross Margin table, gross margin for the 24 stayed constant over the year, averaging 68.4 percent. Celgene earned the highest markup, at slightly over 90 percent, increasing it by five basis points over 2011. As stated, you don't want to see gross margin decrease, but this is what happened to Johnson & Johnson, Novartis, GSK, AstraZeneca, Lilly, Amgen, Hospira, and Endo.
To put the stratospheric margins of the pharma industry in perspective, Apple, arguably the most innovative company in the world despite spending less than three percent of sales on R&D, gets a gross margin of 45 percent on its iPhones. A key strategic question for the industry is whether this top of the league performance on margins can continue in an era of soaring healthcare costs, public budgetary constraints, and a surge of elderly people dependent on fixed incomes. Two prominent CEO members of the 24, George Scangos of Biogen-Idec and Shire's Flemming Ornskov, have stated publicly the industry has to expect less—and to work harder for each sale too.
Net income to sales: the profit metric
The Net Income to Sales table, profit (EBITDA) to sales, measures how well a company manages its pricing and controls expenses. While gross margin was constant for the year, overall profitability decreased, from 26.2 percent to 24.9 percent, suggesting a trend toward pricing power erosion and SG&A expenses that surged out of control. Not surprisingly, the biotechs and specialty firms, with less overhead to wrestle down, demonstrated the highest profitability.
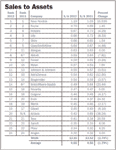
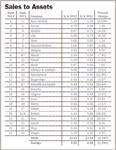
Sales to assets
Sales to assets is another way of reflecting how a company manages those margins by capitalizing on its inventory of assets. The two go hand in hand—or should—because there are only two ways to make money: margin management and asset management. For every dollar invested in assets, how much sales revenue is generated? As the Sales to Assets table shows, Novo Nordisk is at the top with a very efficient, productive ratio of 1.19; that is, for every dollar Novo Nordisk invests in assets, that dollar generates $1.19 in revenues. Roche came in at a distant second, with .70.


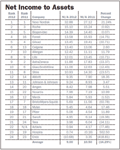
Net income to assets
Net income to assets is a critical metric, along with enterprise value growth and enterprise value to sales. There are companies that excel at margin management or at assset management. You can count the companies that excel at these two primary ways to make money on your right hand—and you won't need all your fingers. The Net Income to Assets table shows an overall average decrease in this metric against the previous year. It is also evidences some pronounced contrasts: the most impressive number is Novo Nordisk's—at 32.88, it is higher than some firms' gross margins. Roche, again, is second, at 15.10.
Sales to Assets
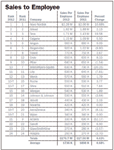
Sales revenue to employee
This metric indicates how productive a company's workforce can be. The higher the ratio, the more productive is its team. The Sales to Employee table shows a dramatic overall decrease in employee productivity, from $898,000 per employee in 2011 down to $736,000 per employee in 2012. On the plus side, Teva's lean management approach helped it score a best-in-group 20 percent gain in sales per employee over 2011.

Net Income to Assets
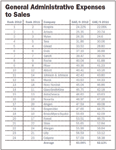
Sales, general, and administrative expenses
SG&A is an important metric but we do not weight it because in any one or two years, a firm might be in the middle of a growth cycle, launching new products and entering new markets. For example, Gilead and Biogen-Idec show increases in SG&A, but the former is revving up for its oral hepatitis C line introduction and the latter is launching a new multiple sclerosis drug. In such cases, SG&A is more an investment than a cost.

However, this ratio, which remains the basic measure of corporate overhead, should not exceed sales or profit growth for an extended period of time. The General Administrative Expenses to Sales table shows that on a group basis SG&A is increasing, from 42.13 perent of sales in 2011 to 43.04 percent in 2012, despite the corresponding negative growth in sales for the industry. It's a ratio that is clearly heading in the wrong direction in so far as future profitability is concerned, and accounts for some of the urgency expressed by investment analysts about changing the basic pharma business model. In this regard, it is worth mentioning that workforce restructuring—firing and laying off employees—shows up as an expense under SG&A, suggesting that the industry record in doing that is better than increasing sales or locking in growth. The figure also includes litigation reserves, another bureaucratic drain on the culture of growth.


Sales to Employee
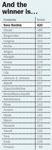
And the winner is…
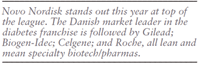
Novo Nordisk ranks top of the league. The Danish market leader in the diabetes franchise is followed by Gilead; Biogen-Idec; Celgene; and Roche, all lean and mean specialty biotech/pharmas.
How did Novo Nordisk do it? It was simple: by running the table on key metrics, and scoring consistently well—if not always the highest—in all areas. The company came in third on creating shareholder value and on enterprise value to sales, both important indicators that reveal future growth and earnings potential. It ranked fourth on gross margin, paced by a long and strong track record in being able to raise prices. A focused commitment to a high potential therapy helps as well: diabetes is a lucrative segment with an enormous well of unmet medical need, particularly from a global perspective. US healthcare spend on diabetes agents increased by 11 percent over the past year; utilization rose by 1.5 percent, while prices posted a gain of 9.5 percent. Not surprisingly, given its broad exposure to the field, Novo Nordisk came in second on profit to sales, pushing up that performance metric by over two basis points.
However, diabetes is an increasingly crowded field, with more room for price discounting. Yet Novo bought some insurance through its surge on asset management (sales to assets), where it achieved a rate of performance not seen since we launched the annual audit. With very high margin management (profit to sales) and asset management (sales to assets), the company ran away with the key metric, return on assets. Finally, Novo Nordisk's employee productivity proved spectacular compared to the rest of the field. And it achieved all this with a SG&A that was actually lower than in 2011.


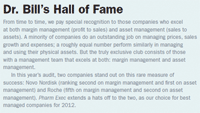
Dr. Bill’s Hall of Fame
The audit is also experiencing some flux, which is to be expected given the pace of change in the industry—half of the current 24 companies on the list are newcomers since this project was launched in 2002. Surprising as it may seem today, then the list lacked a single generic supplier. Two of our current generic companies are a case in point: Mylan and Actavis, far from being mired in a commoditized race to the bottom, experienced substantial increases in shareholder value this year. Mylan's purchase of India's Agila Specialties adds to its expertise in difficult-to-manufacture injectable drugs, while Actavis joined up with Amgen to strengthen its hand in biosimilars. Adding to the aura of Actavis' performance on shareholder value creation, in addition to the Watson tie-in, is the glowing portrait of its growth and earnings potential going forward. Actavis came in at number one on the Bloomberg Business Week's "Nifty Fifty" stocks for 2012, with a surge of 231 percent in its shares over the past year, putting it well ahead of our audit runner ups, Gilead and Biogen-Idec—fast company indeed.
Our newest member of the audit, Hospira, presents an equally interesting case, on the side of adversity. With its manufacturing problems apparently on the mend, the company has only one way to go: up. Like Actavis, it is focusing on difficult to manufacture drugs; more success here may also change its outlook. The company has its sights on the biosimilar market, readying a challenge to the Johnson & Johnson blockbuster Remicade in Europe.

General Administrative Expenses to Sales
Ultimately, the audit is a reflection of the diversity of strategies that are now being employed toward the holy grail of growing sales in a challenging market climate. The ability to do this is the vital differentiator between those companies destined to thrive and those with fading prospects. Our top performing companies price as if the term "price competition" is a street vulgarity; a phrase not to be uttered in polite company. Not only are they superior in pricing to win, with great price elasticity, they are prodigious in controlling costs and managing their physical assets. The companies' employees tend to out produce their counterparts in terms of efficiency and productivity. And these best performers grow sales at a rate much faster than SG&A expenses. As noted, higher SG&A than average over time reflects bloated overhead and administrative inefficiency. Failure to stem that trait means we won't likely be seeing you in the audit five years from now.


And the winner isâ¦
Reinforcing the previous paragraph, let's expand our "Fab Five" to the "Heavenly Seven" by adding two others on this year's list: Amgen and Allergan. Both stood out from the majority by notching up some good numbers on sales growth. While Amgen created shareholder value, coming in fifth, Allergan increased it only slightly, but the modest change was still in the right direction. And Allergan came in third, compared to Amgen, at fifth place, in gross margin performance. Both companies are well above average in profitability (profit to sales) even though Amgen had a bad year managing its assets. Both companies combined an increased profit to assets metric with rising employee productivity. Imagine how Amgen's performance would have been if it had only a modest or average sales to assets ratio. Our conclusion from all the math? It's the ability to externalize exclusivity in the therapy segment and wrest premium pricing from a reluctant payer base that confers the halo to the Heavenly Seven.


Bill Trombetta, PhD, is Professor of Pharmaceutical & Healthcare Marketing at St. Joseph University, Haub School of Business. He can be reached at dtrombet@aol.com.


Cell and Gene Therapy Check-in 2024
January 18th 2024Fran Gregory, VP of Emerging Therapies, Cardinal Health discusses her career, how both CAR-T therapies and personalization have been gaining momentum and what kind of progress we expect to see from them, some of the biggest hurdles facing their section of the industry, the importance of patient advocacy and so much more.